
Stocks versus property in Canada: A tale of many cities (Data)
The topic of Canadian real estate prices in the news media has been centered on the rate of house price growth in Toronto and Vancouver. In August 2016 and June 2017, Vancouver and Toronto real estate prices were growing by a year-on-year rate of 26% and 29%, respectively. As with most property booms, there were corresponding social and political consequences alongside the economic ones. Housing resales exploded as long-term homeowners saw their home valuations reach unimaginable levels and decided to cash in for an early retirement. While the number of real estate agents boomed, social trust in the profession plummeted as a variety of illegal or unethical practices were being identified including fraud, insider trading, shadow flipping,[1] avoiding property transfer and capital gains taxes as well as anti-money laundering protocols.
In Canada no capital gains tax is paid on an individual’s principal residence meaning an historic amount of government revenue has been lost by this tax expenditure. While there are a variety of theoretical public policy reasons for exempting a family’s house from capital gains tax, the fact that this privilege is independent of the price of the home, the amount of profit made on the sale, the number of years lived in the house, or the overall income or wealth of the owner leads to a regressive benefit. As has been known since Roosevelt’s New Deal, the key to maintaining a capitalist democracy is to ensure that growth in private wealth and income translates into a higher level of public investment and services: a rising tide lifts all boats. A general increase in property prices disproportionately benefits the wealthy (who own the majority of property) and the few lucky specialists of the market (real estate agents, architects, developers, builders, etc). While some of this is captured in public revenue through property taxes and land-transfer taxes, this is a pittance compared to the massive accumulation of private wealth.
Increases in land values are more akin to lottery winnings than productive investments. When the price of an Apple or Google stock rises, this usually corresponds to a true increase in the productive capacity of those organizations: new products, better algorithms, etc. Were these profits to be taxed too highly it would diminish the level of investment in real economic activity and research. While land prices may rise due to real economic work (such as tilling farm land or maintenance), in most major cities prices go up because investors want to own real estate assets in that jurisdiction, or a large corporation plans on head-quartering there. In this case, even if 100% of the gains in land values were taxed, it would not discourage real economic activity (although it would decrease liquidity). A key tenet of optimal tax theory is that the highest rates of tax should be levied on the most inelastic goods to ensure the least distortionary outcome.[2] A whole economic movement led by Henry George in the 19th century advocated governments raise revenue through taxing land and classical economists like Adam Smith have noted that such a tax would lead to limited economic inefficiencies. Since municipal land is basically inelastic, this suggests it should be taxed. Of course the construction of buildings and infrastructure represents real and valuable economic activity and it would be foolish to discourage this valuable service. This is why in Australia foreign persons are required to apply through the Foreign Investment Review Board and can only buy new properties. Their stated principles are quite revealing:
The Government’s policy is to channel foreign investment into new dwellings as this creates additional jobs in the construction industry and helps support economic growth. It can also increase government revenues, in the form of stamp duties and other taxes, and from the overall higher economic growth that flows from additional investment. Foreign investment applications are therefore generally considered in light of the overarching principle that the proposed investment should increase Australia’s housing stock (be creating at least one new additional dwelling). Consistent with this aim, different factors apply depending on whether the type of property being acquired will increase the housing stock or whether it is an established dwelling.
As with any asset boom, social tensions grow between the haves and the have-nots. This is especially pronounced when the asset is a commodity required by all citizens to live such as food or housing. While equity booms, like the dot-com bubble, tend to benefit a sliver of the population, they do not tend to lead to significant regional inequalities. In contrast the growth of Silicon Valley as a whole has translated in the higher property prices for the entire Bay Area, leading to a mass exodus of middle class families. Imagine two neighbours John and Jane living side-by-side – one a renter and one who has owned their home for a decade. John rents his home from a foreign owner he has only met once. While rent increases for John are limited by rent control laws, he knows that if he had to move he would face a significant increase in his rental cost due to a decade of house price growth. He therefore feels barricaded in his current property hoping that family illness or a returning landlord will not dislodge him from his limited economic sanctuary. At the same time his close neighbour Jane has seen her initial investment double in a 10 year period. While John may have a slightly better job than Jane, he knows Jane’s net worth may be close to a million dollars now and he can tell that money has stopped being an issue for her. While news stories about twenty-somethings becoming billionaires from an IPO of some iPhone App or the Queen’s Koh-i-Noor jewels are an idle amusement for John, he feels the pangs of jealously and regret so much more acutely from his neighbour Jane whom he has known for many years and to whom he feels so similar. Why are their economic outcomes so different given their similar backgrounds, education, and salaries? Such are the social strains that emerge during property booms. A similar level of strife and jealousies emerged during the fracking boom in certain US towns where older residents whose land titles included mineral rights made significant windfalls whilst newer community members received no such dividends but had to live with increase in water pollution from the process of natural gas extraction.
However the question of this blog post is this: how fast have housing prices grown in Canada and by which city? For how long have Vancouver and Toronto seen prices increase at a rapid clip? And how does this compare to the benchmark Canadian stock index? This question can be answered by using the Teranet and CREA house price indices (HPI). Both indices use a representative or quality-adjusted measure of house prices. While Teranet has been collected for a longer period of time, CREA gives us insight into different set of cities and also includes different property types (apartments, single-family homes, etc). My choice for a Canadian stock index was the S&P/TSX Composite Index, which has 250 of Canada’s largest joint-stock companies. Because this index is skewed towards the resource sector and Canada’s big banks it would not make for a diversified portfolio. However it is the appropriate index to choose for contrasting Canadian property to Canadian equity returns.
The measures below are not meant to determine whether saving income through stocks is a better long-run investment strategy compared to property ownership due to a plethora of factors. A full and fair comparison would require taking into account: 1) capital gains tax exemptions on the primary residence, 2) the level of capital gains tax on stocks, 3) the use of RRSPs and TFSAs to defer or remove tax liabilities along with the owner’s personal income, 4) ownership costs of each asset class (brokerage and realtor fees), home insurance, uninsurable risks, maintenance costs, etc, 5) personal preferences for ownership (ability to paint walls, etc), and 6) expected number of moves a person will make. Furthermore estimating the value of equity ownership would require comparing the rate of return for different portfolios which are based on historical data.
Figure 1 below shows the annualized rate of return for owning a representative property in a given Canadian city (coloured dots) compared to owning the S&P/TSX. For example a value of 5% at 1997 implies that if you bought \$100 of property in that year and sold in in 2019 you would have earned a total return of $(1.05)^{2019-1997}-1=1.05^{22}-1=1.93$ which is an 193% return, or around a tripling of value (such is the power of compounding returns). This horizontal axis gives us an historic snapshot of the return that different homebuyers in different years have earned. Note that these are nominal calculations and one should subtract 2% off each number to get the approximate real rate of return. These values also use yearly averages meaning that the price of a house in 1997 is an average of all the months in that year.
Figure 1: Teranet house price growth
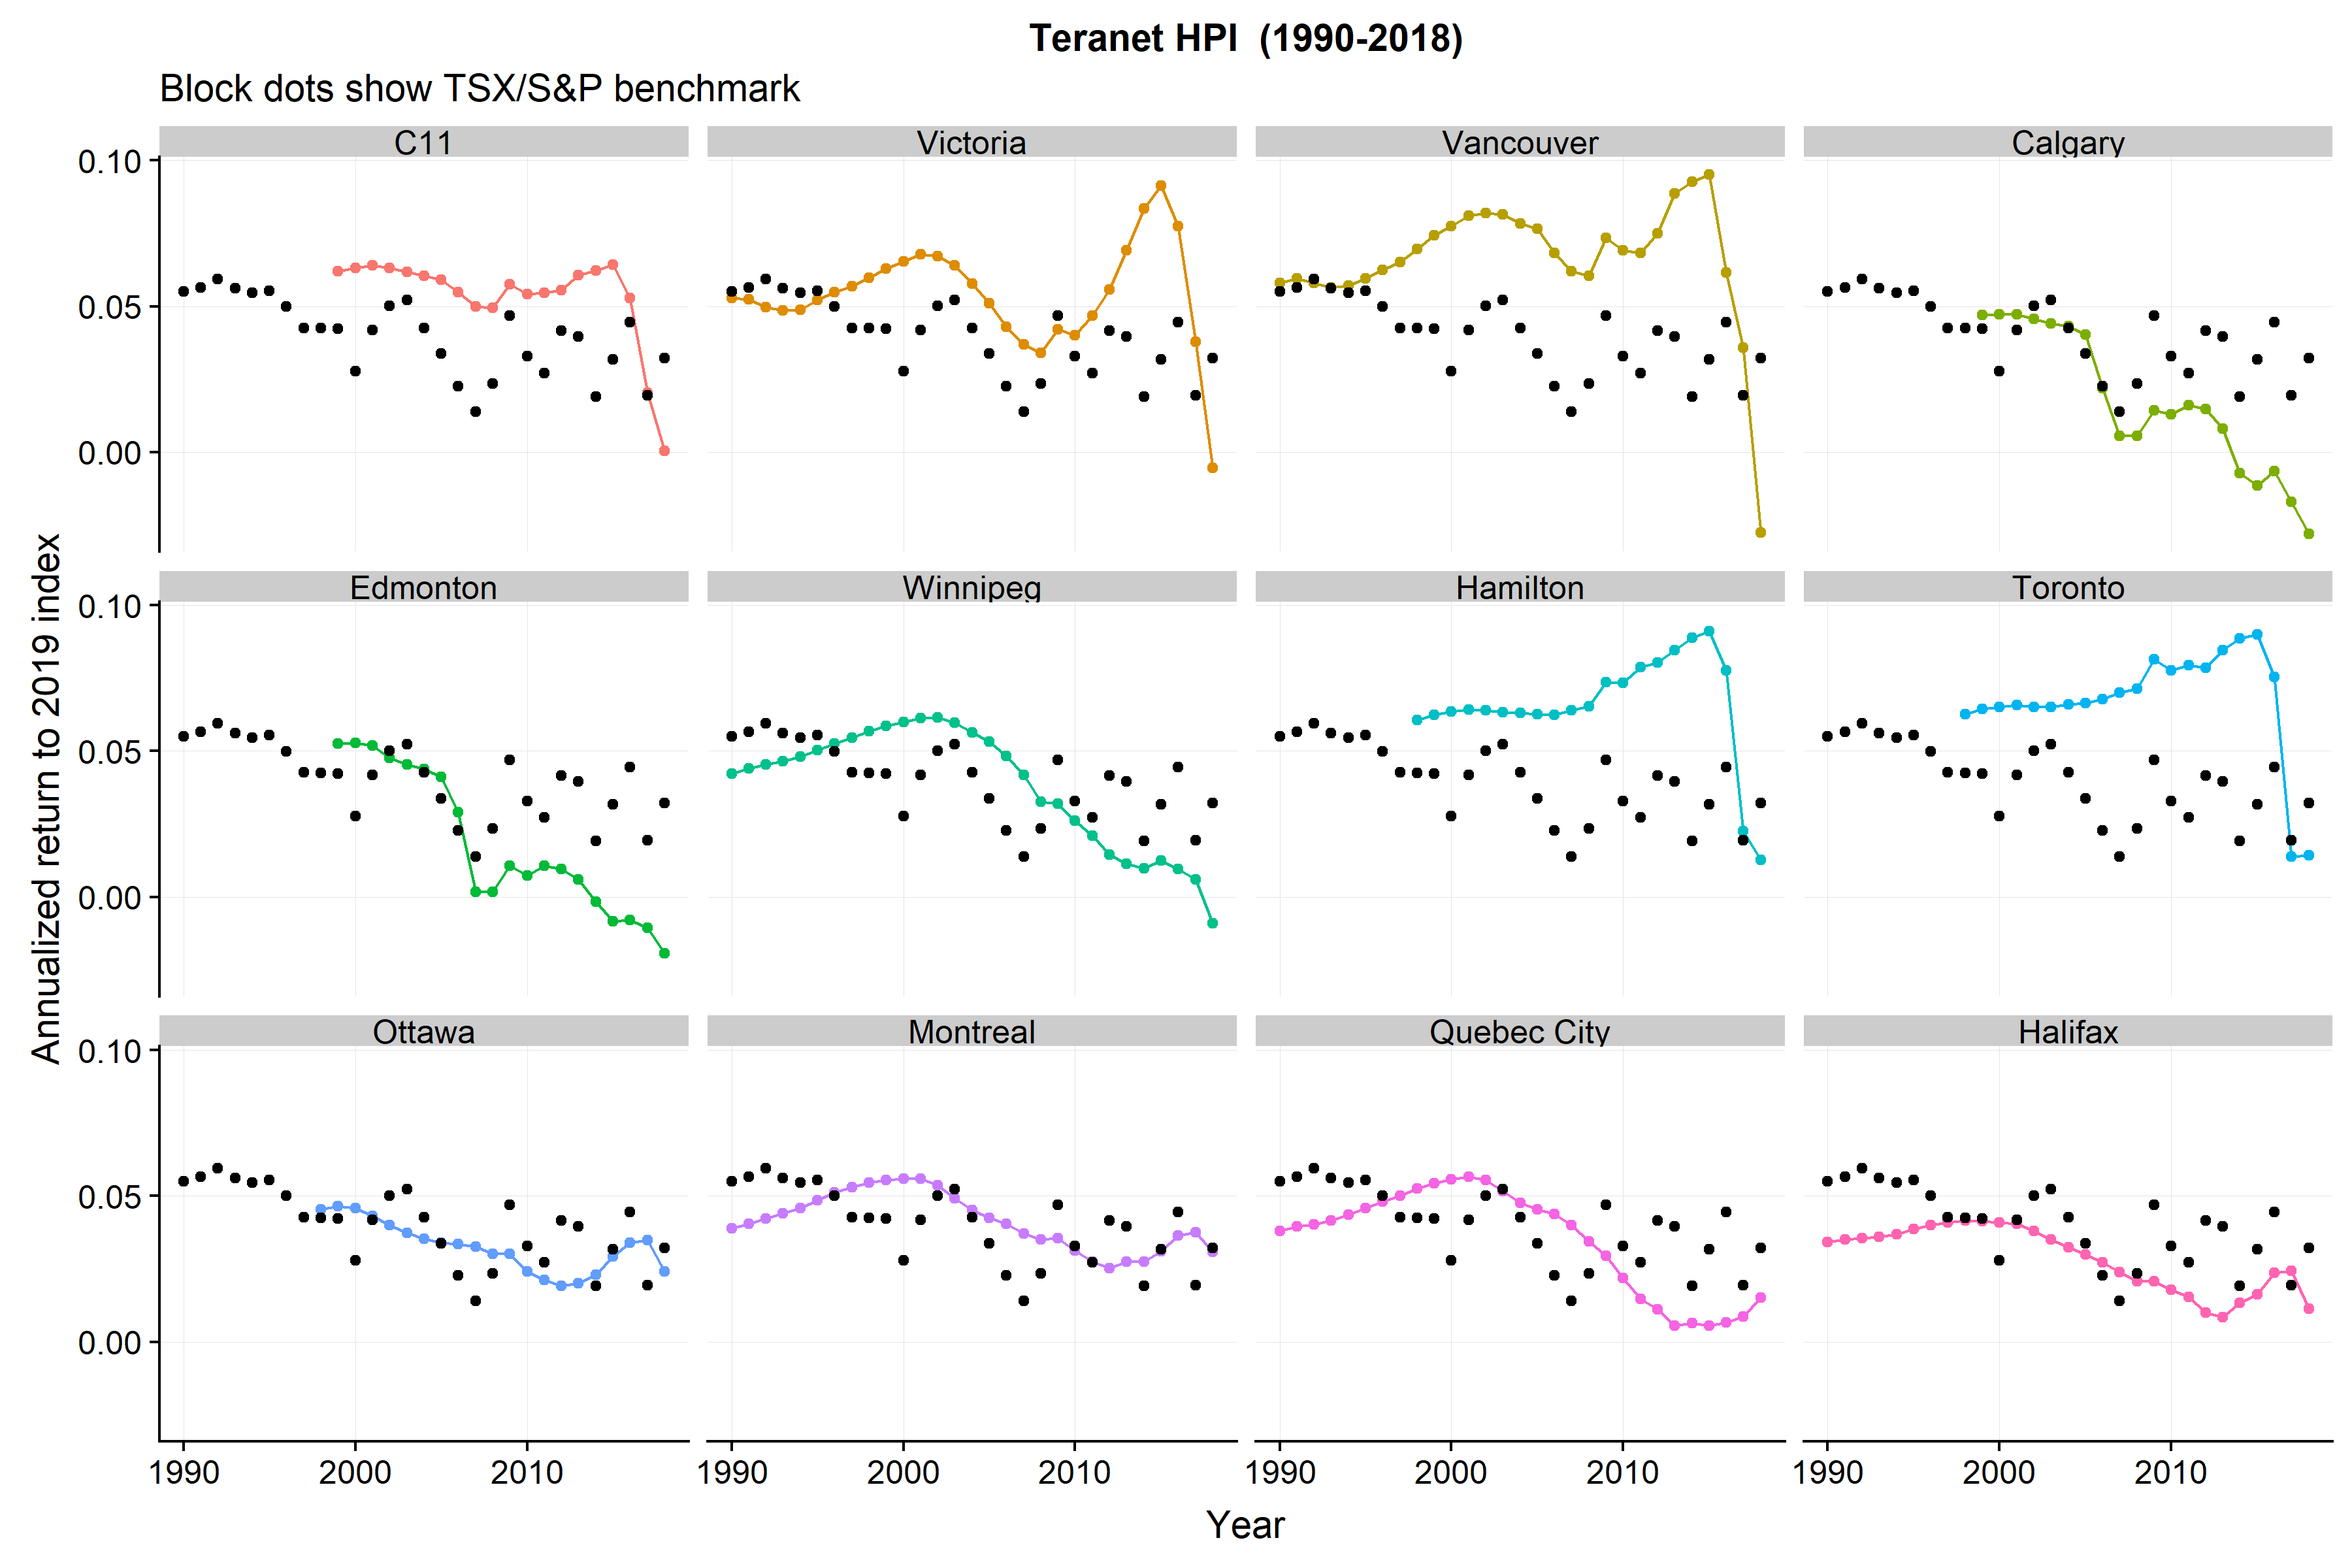
Three distinct regional patterns emerge. Toronto/Hamilton and Vancouver/Victoria have seen price growth exceed the TSX returns for almost every year for which calculations were possible (the most recent years being the exceptions). Cities in the Prairies and Atlantic like Calgary, Edmonton, Winnipeg, and Halifax have not done well and have performed well below the TSX. In the middle are cities like Ottawa, Montreal, and Quebec City which have done better in some years and performed worse in others. The bottom line is outside of the GTAH and GVVA corridors home ownership in the rest of Canada has not been a financial windfall. While a large share of the Canadian population lives in these area (~10 million or a quarter of the national population), even if half of the residents in this region own their homes, this means that only one in every eight Canadians are sitting on a highly valuable asset.[3]
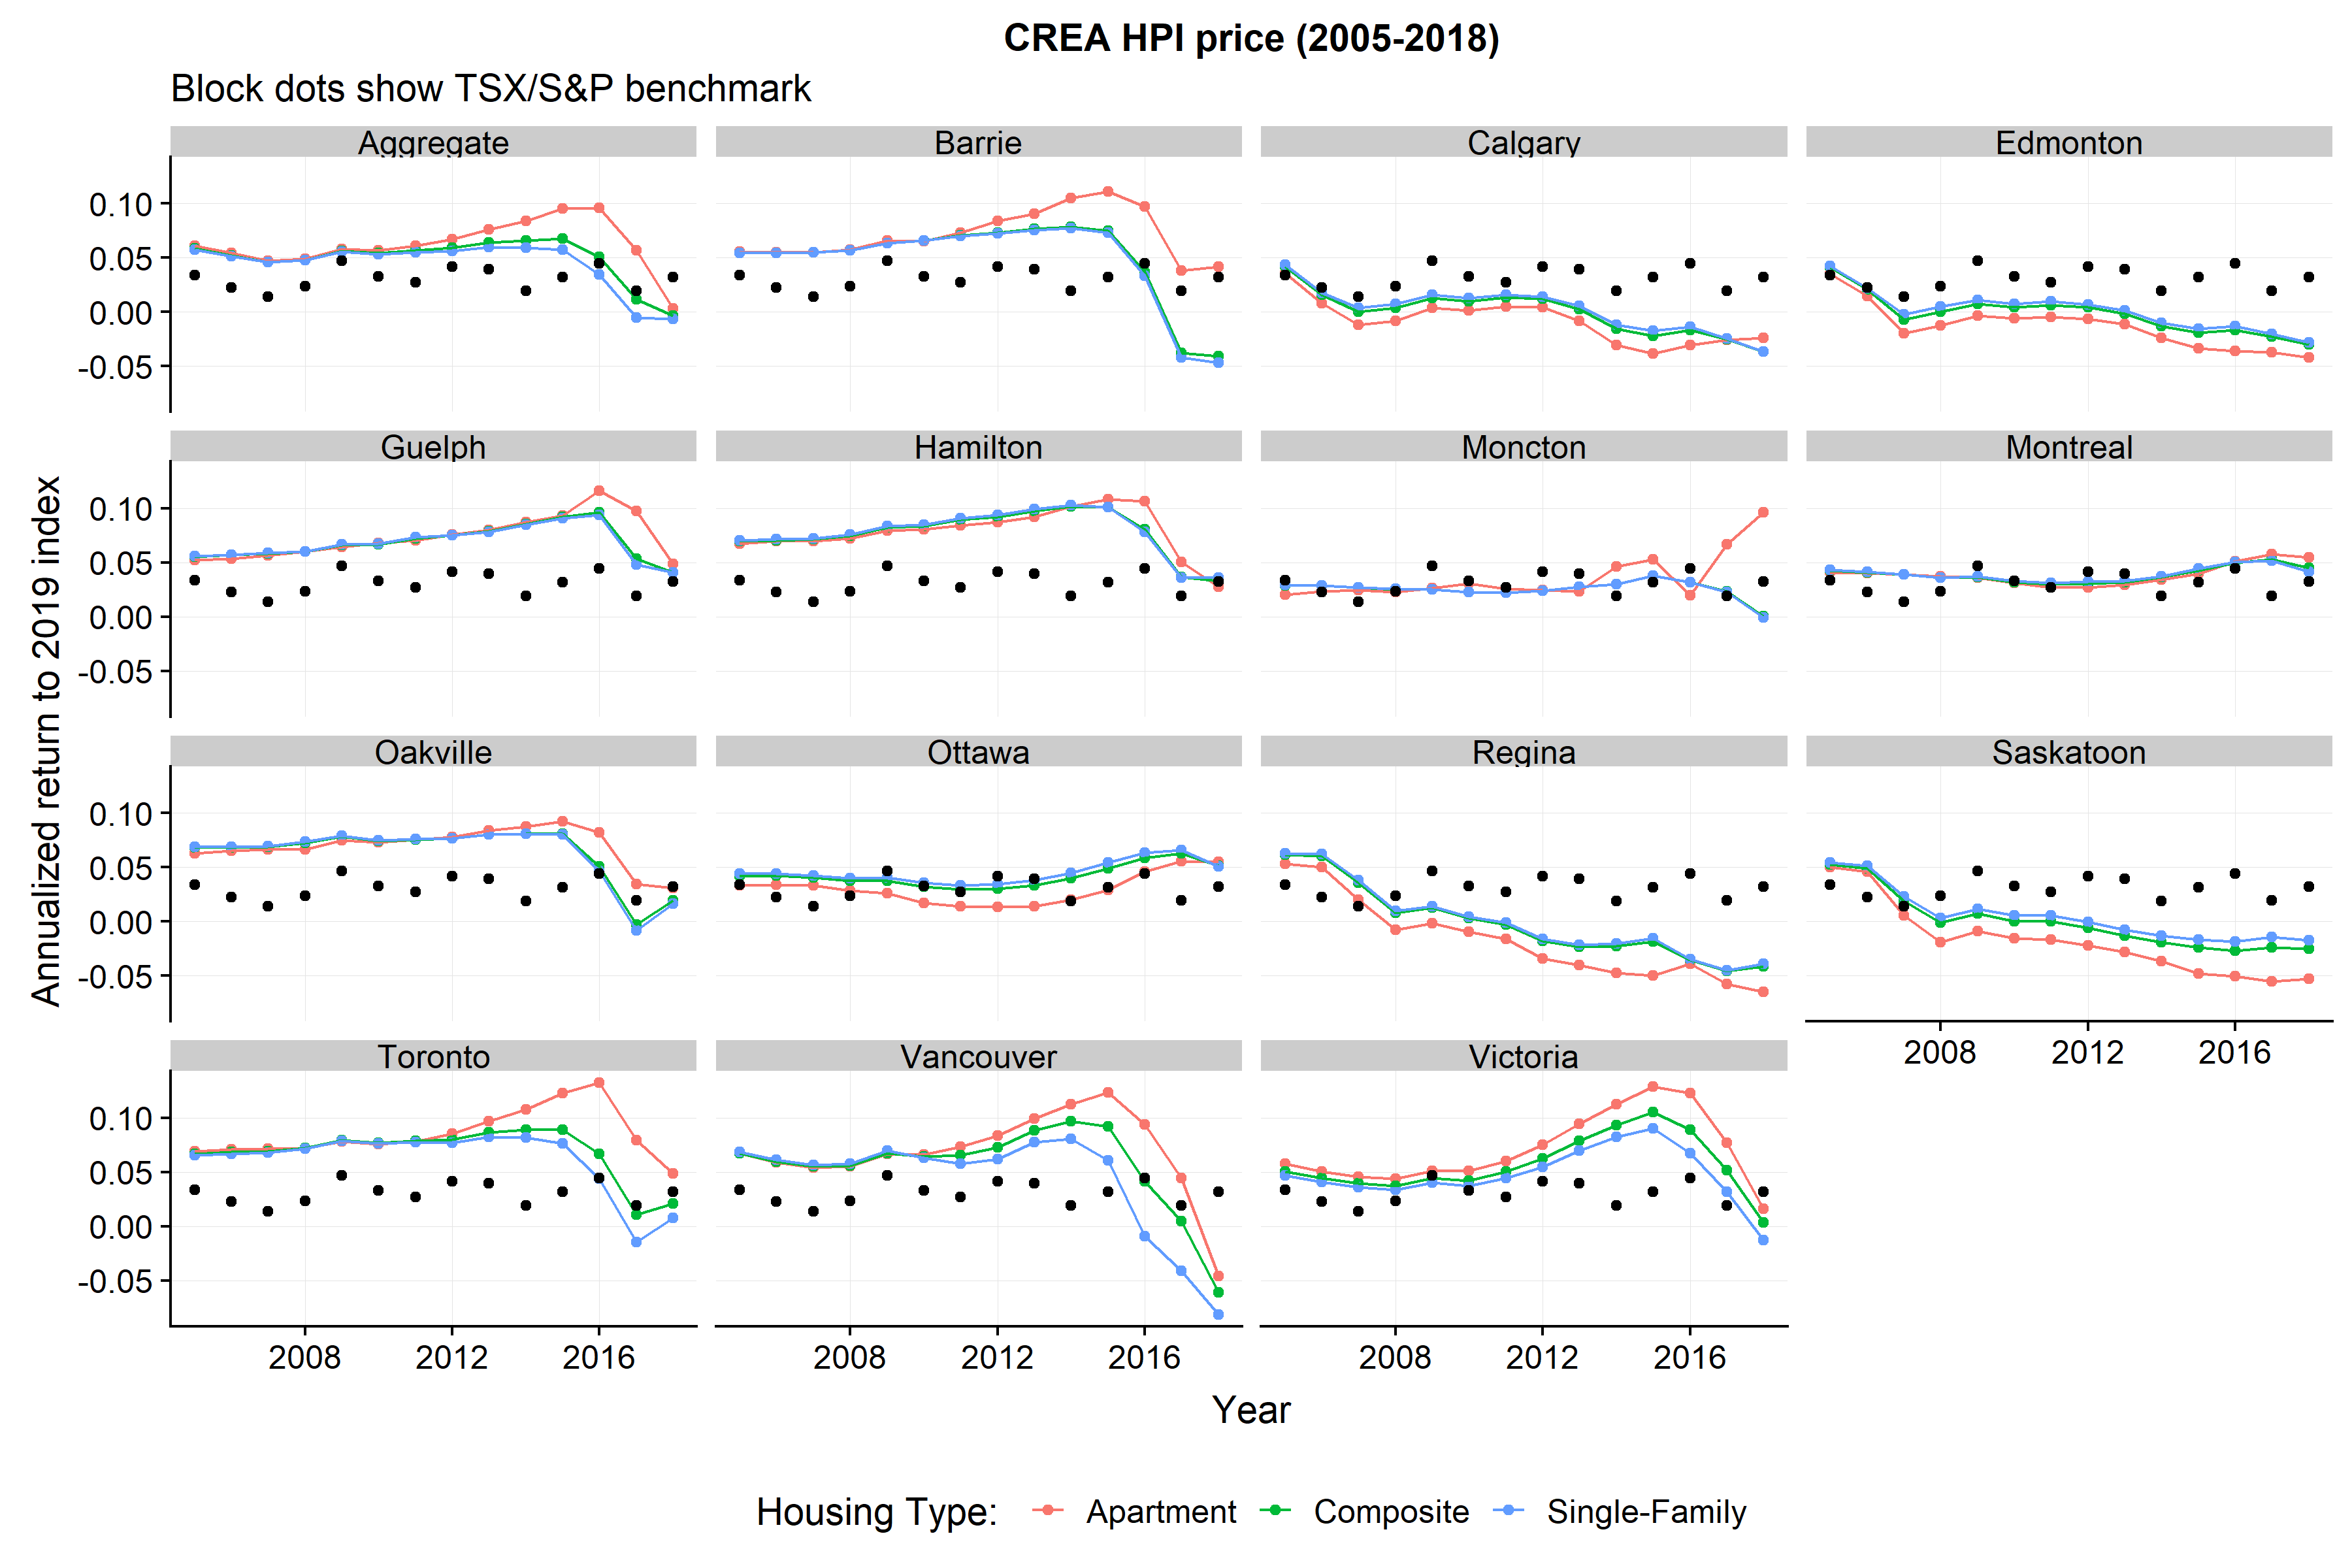
The CREA data seen in Figure 2 reinforces this point with weak growth in Saskatoon and Regina and price spillovers in areas within commuting distance of Toronto (Guelph and Barrie). Interestingly the performance of apartments seems to have done better in recent years than single-family homes although this measure would be quite different if it were calculated several year ago (i.e. 2019 saw a mean reversion for many single-family dwellings). The code and data to replicate these figures can be found here.
Figure 2: CREA-HPI house price growth
Overall the picture is clear for the Canadian housing market: there is no single story, only a collection of distinct regional stories. The attention-grabbing headlines of blockbuster growth in Vancouver and Toronto have not been seen by the rest of the country (where the majority of the population lives), and in 2018/2019 prices have settled in both these cities likely helped by a foreign buyers tax and increased attention on financial risks. A home-owner who bought property in Ottawa or Montreal anytime in the last 30 years would have been just as likely to make as much money buying a benchmark index of Canadian stocks. Will the same regional dynamics hold in future years? It is impossible to say. Property price growth is influenced by both public policy decisions[4] and exogenous economic forces[5]. Other small open economies like Norway (which is also reliant on natural resources) saw house prices in Oslo almost triple from from 2005-2016 and then remain flat for the next three years. No one actually knows what will happen. Whether or not it is true, one comfort of believing in the efficient markets hypothesis is that prices already incorporate all available information. Therefore a saver just needs to ensure that they are optimizing their savings rate relative to their expected lifetime income and let the future play itself out.
-
This occurs when a real estate agent simultaneously represents both a seller and a buyer without either party knowing this, buys the property at a cheaper price from the seller and then resells it to the final buyer at a higher price. In addition to pocketing the spread he also avoids having to pay the land-transfer tax multiple times. ↩
-
The magnitude of a distortionary action is the quantification of the decrease in the level of economic activity that arises from any given policy. If the application of a 10% surtax on cigarettes lead to no change in the number of cigarettes that were purchased then this tax would be said to have no distortionary consequences. ↩
-
Of course many people who have sold their homes at a windfall may have left the region, but the broader point still remains. ↩
-
For example government policies around the maximum amortization period, zoning and density restrictions, the capital gains tax exemption on ones primary residence and the use of RRSP funds for a downpayment, foreign buyers taxes, and domestic interest rates all impact the level of house prices. ↩
-
If oil prices were to rebound one could imagine cities in the Prairies seeing sustained price growth again. ↩